Part:BBa_K1893016:Experience
This experience page is provided so that any user may enter their experience using this part.
Please enter
how you used this part and how it worked out.
Applications of BBa_K1893016
Characterisation data
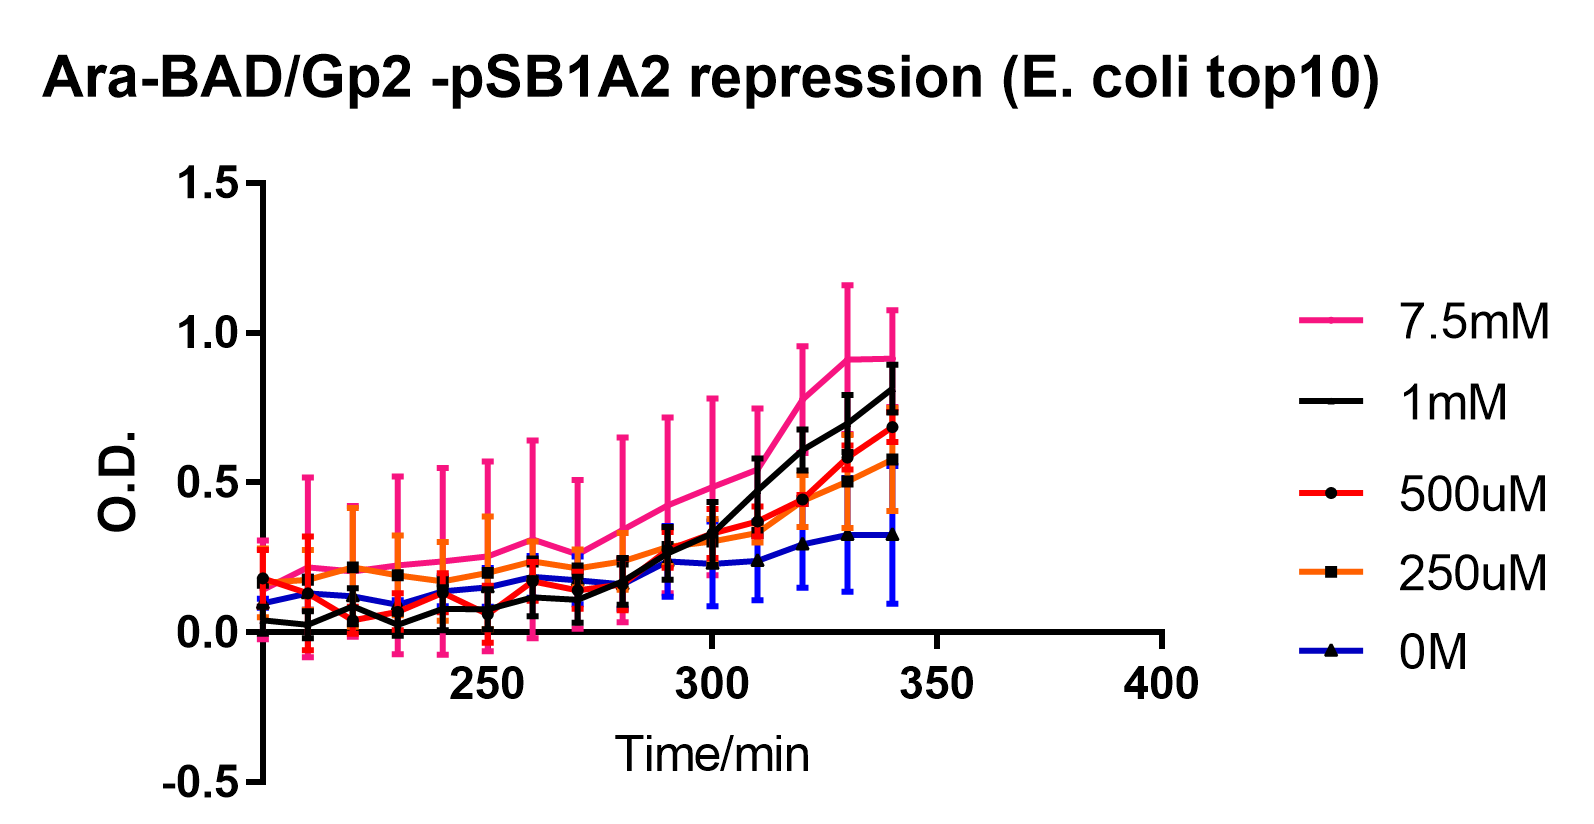
Figure 1: Growth inhibition of Top10 cells by induction of Gp2 by L-arabinose. Experiments were performed in E. coli Top10 cell strain cultured at 37°C, which were diluted to 0.05 O.D. and inoculated with L-arabinose at the 0 minute timepoint. O.D. was recorded at 600nm. Reported values represent the mean normalised O.D. for three repeats, with error bars representing standard deviation.
Figure 2: Recovery of growth by TOP10 cells after arabinose-induced pBAD operon was switched off by glucose-mediated catabolite repression. 100uM of L-arabinose was added to the culture 2 hours before the 0 minute timepoint and D-glucose was added at the 0 minute timepoint. pBAD-GFP controls indicate that the pBAD operon was switched off at approximately after approximately 250 minutes. Experiments were performed in E. coli Top10 cell strain cultured at 37°C, which were diluted to 0.05 O.D., which was recorded at 600nm. Reported values represent the mean normalised O.D. for three repeats, with error bars representing standard deviation.
User Reviews
UNIQ20d97f77e6f3218d-partinfo-00000000-QINU UNIQ20d97f77e6f3218d-partinfo-00000001-QINU


